Employee Retention Metrics: Measuring the Key to a Thriving Workforce

Employee retention is pivotal for businesses that cultivate a productive and satisfied workforce.
High employee turnover is costly and disruptive.
No wonder companies go to great lengths to keep employees happy and engaged so that they won’t leave.
But, in order to make sure their efforts are effective, they must also track results.
Companies with data-driven PeopleOps teams use a range of metrics to gauge their success in retaining their workforce.
This article explores these employee retention metrics.
We’ll look at key metrics to track, as well as calculations, best practices, case studies, and more.
Understanding Employee Retention Metrics
In any performance aspect, knowing the barriers to success is half the battle of overcoming them.
Measuring employee retention enables companies to identify areas of improvement in the employee experience they offer, enhance employee satisfaction, and reduce turnover costs.
At the least, PeopleOps teams should track:
- The frequency at which employees leave the company,
- Reasons for their departure, and
- How the company’s turnover compares to industry standards.
We can keep tabs on retention in real time by tracking these aspects of employee retention.
This helps HR teams determine the severity of a retention problem as quickly as possible and respond.
If employee retention is not optimal, organizations can implement strategies to create a more engaging and nurturing work environment.
What are Employee Retention Metrics?
Employee retention metrics are quantitative measurements used to evaluate the effectiveness of an organization's efforts in retaining its employees.
These metrics provide objective insights into the rate at which employees stay with a company.
Retention metrics also track employee satisfaction and the financial impact of employee turnover.
Retention metrics are useful to perform periodic “health” checks.
For example, to track resignations month on month. It is also useful to identify patterns that are essential to workforce planning.
For example, if resignations spike at a certain time of the year, it is fair to expect this trend to continue.
With this insight, the company in question can increase seasonal retention initiatives.
They can also recruit to make up for an expected shortfall in staff.
Did you know?
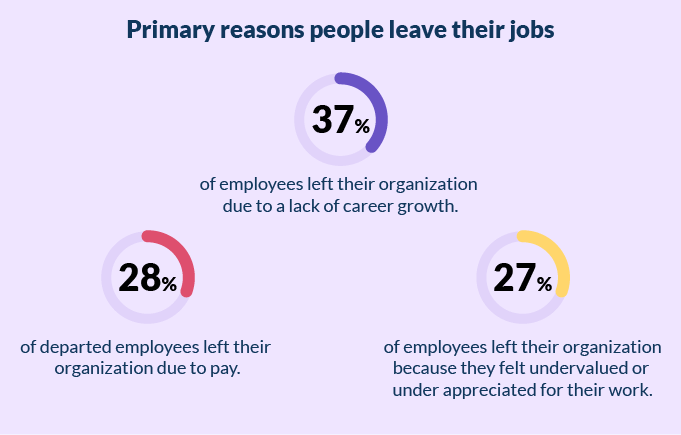
Pic credit Employee turnover statistics
Companies can track results by looking at historical data vs. the present situation.
This helps PeopleOps teams see when retention initiatives produce a positive result.
Metrics also help quantify such efforts' return on investment (ROI).
If, for example, the HR team buys and implements an employee engagement software, there would be a cost to it. However, if the software improves retention, it will lead to trackable cost savings in recruitment.
It would also curb lost productivity caused by employee turnover. Thanks to implementing employee engagement software, the company can use metrics to determine a dollar figure they’ve saved.
Key Employee Retention Metrics
Employee retention metrics encompass several vital indicators that provide a comprehensive view of a company's employee retention efforts.
None of these metrics can give a holistic picture of retention by themselves. But, when seen as a dataset, they can offer wonderful insights.
1. Employee Turnover Rate
Employee turnover rate is a fundamental metric of employee retention.
It refers to the percentage of employees who leave the company within a specific period.
A high turnover rate suggests the company may struggle to retain its talent.
We can track employee turnover over a given period.
It can be a monthly, quarterly, and annual metric.
It is useful in identifying seasonal trends in talent turnover and comparing retention year-on-year.
Because turnover is a percentage, it factors in company growth.
We can also subdivide employee turnover into the following classes:
Voluntary turnover rate: Employees who resigned
Involuntary turnover rate: Employees who retired, were fired, or who were lost to layoffs
Overall turnover rate: A combination of voluntary and involuntary turnover
We can also measure new employee attrition with the turnover metrics.
New employee attrition is the turnover of employees who leave an organization within the first months after joining it.
Employee Turnover Rate Calculation
Here’s how you can calculate the employee turnover rate.
Divide the number of employees who left during a specified period by the average headcount during the same period.
To determine the average headcount, add your headcount at the start and end of the period together. Divide the total by two.
Formula for Employee Turnover Rate
Total number of employees who have left / [(headcount at start of period + headcount at end of period beginning) / 2]
Multiply the result of your calculator by 100 to get the percentage.
2. Employee Retention Rate
Employee retention rate is the inverse of employee turnover.
It is a metric that measures the percentage of employees who remain with a company over a specified period.
It is a key indicator of how well an organization retains its employees.
A high retention rate is generally considered positive.
It suggests that the organization is successful in retaining its talent.
A low retention rate may indicate challenges in employee satisfaction, engagement, or other factors contributing to turnover.
Monitoring the employee retention rate allows organizations to identify trends, address potential issues, and implement strategies to improve employee satisfaction and retention.
Examples of strategies for improving retention are:
- Offering competitive compensation and benefits
- Providing opportunities for career development
- Fostering a positive company culture
- Addressing concerns raised in employee feedback
We can track employee retention over time (monthly, quarterly, annually, seasonally, etc).
We can also track it per department or measure the overall retention rate of an organization.
The formula for Employee Retention Rate
Number of employees at the end of the period/number of employees at the start of the period.
Multiply the result of your calculator by 100 to get the percentage.
Average Employee Tenure
3. Average Tenure Calculation
This metric measures the average duration an employee remains with the organization.
It reflects the stability and loyalty of the workforce.
According to the Bureau of Labor Statistics, the average length of employment for men in the US was 4.3 years in 2022.
For women, the median tenure was 3.8 years.
However, benchmarks for average employee tenure vary drastically between industries.
Calculate the average tenure by adding the total number of years employees have been with the company together.
Divide this number by the total number of employees.
Formula for Average Tenure
[Duration of employee A’s service + duration of employee B’s service + ... ] / Number of employees
4. Cost of Employee Turnover
The cost of turnover metric quantifies the financial impact of employees leaving the company. Turnover costs include:
- Costs related to recruitment and the hiring process
- New employee training
- Decreased productivity during the transition period
Although companies can go to great lengths to improve retention, some employees will inevitably leave.
We can identify ways to limit the financial impact of retention by tracking the cost of employee turnover.
Tracking these metrics lets PeopleOps teams know which specific implementations successfully counter turnover costs.
For example, by investing in an applicant tracking system (ATS), a company can reduce the average time to fill a vacancy.
This would, in turn, also reduce the loss of productivity while the role is vacant.
Comparing the cost of employee turnover before and after implementing an ATS will quantify its ROI in this regard.
Cost of Employee Turnover Calculation
Add up all costs related to employee turnover, including recruitment, training, and lost productivity.
Divide this total by the number of employees who left.
5. Employee Satisfaction and Engagement
Measuring employee satisfaction is essential for understanding the workforce's contentment with their roles and work environment.
Satisfied employees are more likely to stay at your company.
Employee engagement metrics gauge employees' commitment and enthusiasm for their work.
Engaged employees tend to be more loyal and productive.
Measuring Employee Satisfaction and Engagement
Give any relevant image here
Employee satisfaction and engagement can be measured through surveys, feedback, and evaluations.
Qualitative data should also be considered when assessing these metrics.
Metrics for Measuring Employee Satisfaction and Engagement
Metrics that measure employee satisfaction and engagement include the following:
Employee Absenteeism Rate
Employee absenteeism rate (or absence rate) measures the scheduled work hours that employees miss due to unscheduled absences. It is commonly expressed as a percentage
Employee Absenteeism Rate Calculation
We can calculate employee absenteeism rate by dividing the hours employees were absent by their scheduled work hours.
We can track absenteeism rate per employee over a period (for example, per quarter).
We can also calculate it per team, or across a whole organization.
The formula for the Absenteeism Rate
Total number of hours absent/total number of scheduled work hours
Multiply the result of your calculator by 100 to get the percentage.
Employee Satisfaction Index
The employee satisfaction index is a metric that measures the overall job satisfaction of employees within an organization.
It is often used as a key performance indicator to assess how content staff members are in their work environment.
We can derive the index from survey responses or assessments — generally run by employee engagement software.
The surveys let employees score their satisfaction regarding different aspects of their jobs.
These aspects can include workplace culture, leadership, and overall work experience.
Similarly, we can track new employee satisfaction rates by asking new hires to score a company’s onboarding process.
Formula for calculating the employee satisfaction index
ESI = (question mean value/3) x 100.
We calculate a company’s employee satisfaction index based on the aggregated scores.
A higher index score typically indicates higher levels of employee satisfaction.
A lower score may suggest workplace improvement areas.
When this happens, HR professionals can investigate to see which aspects of their work employees scored lower.
Organizations can identify strengths and weaknesses in their work environment by tracking employee satisfaction continuously.
Based on this insight, we can implement strategies to enhance overall employee well-being and engagement.
High employee satisfaction often correlates with increased productivity, better employee retention, and a positive organizational culture.
Work Time
Work time encompasses the hours and minutes an employee spends “on the clock.”
Work time can vary depending on the nature of the job, industry, and specific organizational policies.
Typically, this metric applies to organizations with shift-based employment, which pays based on hours worked.
We can break work time up and track it as follows:
1. Regular Work Hours
These are the standard hours established by an employer. Employers expect employees to be present and perform their job duties during regular work hours.
2. Overtime
Overtime refers to any hours an employee works that exceed regular work hours. It is important to track overtime worked per department for the sake of workforce planning and retention. Overworked employees are more likely to leave. Hiring more hands in departments where overtime is prevalent is therefore an investment in employee retention.
3. Active Time
Active Time constitutes a portion of work time. Tracking active time holds significance in assessing employees' engagement, especially remote employees. We can characterize it as the time an employee actively dedicates to a specific task. It can also be the time they spent on a specific application.
Specifically, active time represents the overall period an application operates in the foreground of an employee’s computer. We can use productivity and time-tracking software installed on their device to get this insight. An employee with low active time will likely be unengaged and unproductive.
Employee Net Promoter Score (eNPS)
Organizations use the employee net promoter score (eNPS) to gauge the loyalty and enthusiasm of employees toward their workplace.
It is an adaptation of the traditional net promoter score, which is commonly used to measure customer loyalty.
The eNPS assesses the likelihood of employees recommending their organization as a good workplace.
eNPS Calculation
We typically determine the eNPS through a survey that asks employees a single key question:
"On a scale of 0 to 10, how likely are you to recommend [company/organization] as a place to work?"
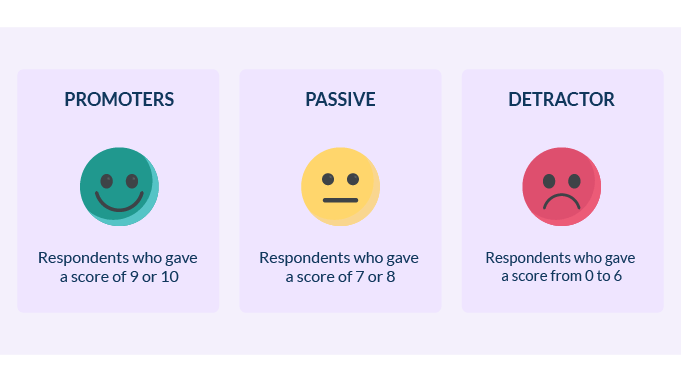
Based on their responses, we can categorize them into three groups:
- Promoters (score 9-10): Highly satisfied Employees who are likely to recommend the organization.
- Passives (score 7-8): Employees who are satisfied but may not actively promote the organization.
- Detractors (score 0-6): Employees who are dissatisfied and unlikely to recommend the organization.
We then calculate eNPS by subtracting the percentage of detractors from the percentage of promoters. The resulting score can range from -100 to 100.
- A higher eNPS indicates a more positive employee sentiment and a greater likelihood that employees will recommend the organization.
- The goal is to have a positive eNPS. It suggests a positive workplace culture, employee satisfaction, engagement, and retention.
Organizations can identify areas for improvement when they regularly measure the eNPS and understand the reasons behind these scores.
Based on this insight, PeopleOps teams can implement strategies to enhance the overall employee experience.
Formula for eNPS
eNPS=Percentage of Promoters− Percentage of Detractors
The Impact of Employee Retention Metrics
By closely monitoring employee retention metrics, HR departments can identify areas that need improvement and develop strategies to retain talent effectively.
Tracking these metrics can point to a need for any one (or multiple) of the following interventions:
1. Boosting Employee Morale
By tracking retention, employers can be aware of dips and declines in employee morale.
The two are highly correlated.
Poor employee morale creates turnover, which is also a symptom of high turnover among employees who stay.
Acting on these dips in morale sends a strong signal to employees.
It shows them how invested their employer is in their well-being and satisfaction.
This reassurance can boost employee morale, leading to increased productivity and loyalty.
2. Providing Growth Opportunities
Employee turnover is often a symptom of limited perceptions of career development opportunities.
The employees feel they need to leave to move forward professionally.
Offering opportunities for professional development and career advancement can significantly enhance employee retention.
3. Cost Savings
Tracking employee retention metrics can significantly benefit companies by helping them identify opportunities to save costs in various ways.
-
Reduced Recruitment and Onboarding Costs
High employee turnover necessitates frequent recruitment and onboarding processes. These activities involve expenses related to advertising positions, conducting interviews, and training new hires. By retaining employees, companies can minimize these recurring costs.
-
Increased Productivity and Efficiency
By tracking and improving the average tenure of employees, we make an organization more effective by preserving institutional knowledge. Long-term employees are more familiar with their roles, company processes, and systems.
Lower turnover means a more experienced workforce, increasing productivity and efficiency. Reduced disruptions from turnover can translate into cost savings. This is because the company can maintain a consistent workflow and avoid gaps in service or production.
-
Savings on Training and Development
Training new employees incurs costs related to materials, trainers' time, and potential external training programs. Higher retention means a lower need for frequent training. This allows companies to invest more strategically in continuous development for existing staff rather than repeatedly training new hires.
-
Improved Employee Engagement
Satisfied and engaged employees are more likely to be productive and committed to their work. Companies with lower turnover rates often enjoy higher levels of employee engagement.
This engagement leads to increased overall performance and reduced costs associated with disengagement. Examples of these costs are lower productivity and higher absenteeism.
-
Enhanced Company Reputation
High turnover rates can negatively impact a company's internal and external reputation. A reputation for high employee turnover may make it challenging to attract top talent. This can potentially lead to increased recruitment costs.
Conversely, jobseekers see companies with strong retention rates as desirable employers, reducing the need for costly recruitment efforts.
Technology and Employee Retention
As with any other form of data, employee metrics are most accurately tracked when we use a dedicated tool.
This number above can be changed with the help of proper employee retention software.
The best HR software for employee retention metric tracking includes:
- Human resources information systems (HRIS)
- Human resources management systems (HRMS)
- Employee or people analytics tools.
These systems act as the custodians of all employee data.
They can report both at a granular and organizational level in real time.
Some analytics tools also offer predictive analytics.
This AI-driven feature can help human resources teams stay ahead of trends in tenure, absenteeism, etc.
A dedicated employee engagement or experience software is ideal for measuring employee satisfaction and engagement metrics.
These tools periodically send out pulse checks and employee engagement surveys.
The results of these surveys help HR teams keep a finger on the pulse of workforce sentiments.
As technology evolves, employee retention metrics will likely become more data-driven, with advanced analytics helping companies devise more effective employee retention strategies.
Final Thoughts on Employee Retention Metrics
Employee retention metrics are not merely statistics.
We should rather view these metrics as vital tools to help keep employees satisfied, motivated, and loyal.
The ultimate benefit of understanding and utilizing employee retention metrics is financial gain.
Businesses get actionable insight from tracking these metrics.
It enables employers to create an optimal work environment where employees remain and thrive.
A thriving workforce drives the business forward to achieve success.

Frieda-Marié de Jager is the Senior Content Marketing Editor for SelectSoftware Reviews. She has written about technical subjects, including corporate compliance, customs law, and technology, for over 12 years. She holds a BTech degree in design and is a published short story author in her homeland, South Africa. She has also spent the last 5 years developing online learning material and the last 16 years leading world-class design, marketing, and writing teams. For any related queries, contact editor@vantagecircle.com.

")